

Hosted workspace · Pine v6 · Binance klines
Backtest your Pine Script
and find out which parameters
actually mattered.
IndicaView is a hosted Pine Script v6 backtester and strategy
research workspace for crypto. It runs your strategy against live Binance
klines and reports equity, drawdown, Sharpe, Sortino and 40 other metrics —
then searches your input() parameters with seven algorithms,
including multi-objective NSGA-II, which returns a
Pareto front instead of a single winner.
Key facts
- Engine
- Pine Script v6, executed by PineTS
- Data
- Live Binance klines, fetched by your own browser
- Optimizers
- 7 algorithms, incl. multi-objective NSGA-II
- Analysis
- 8 views over the recorded trials
- Delivery
- Hosted — nothing to install, nothing to self-host
- Cost
- Usage metered in credits. No plan priced yet. No broker, no order execution
01 — Workspace
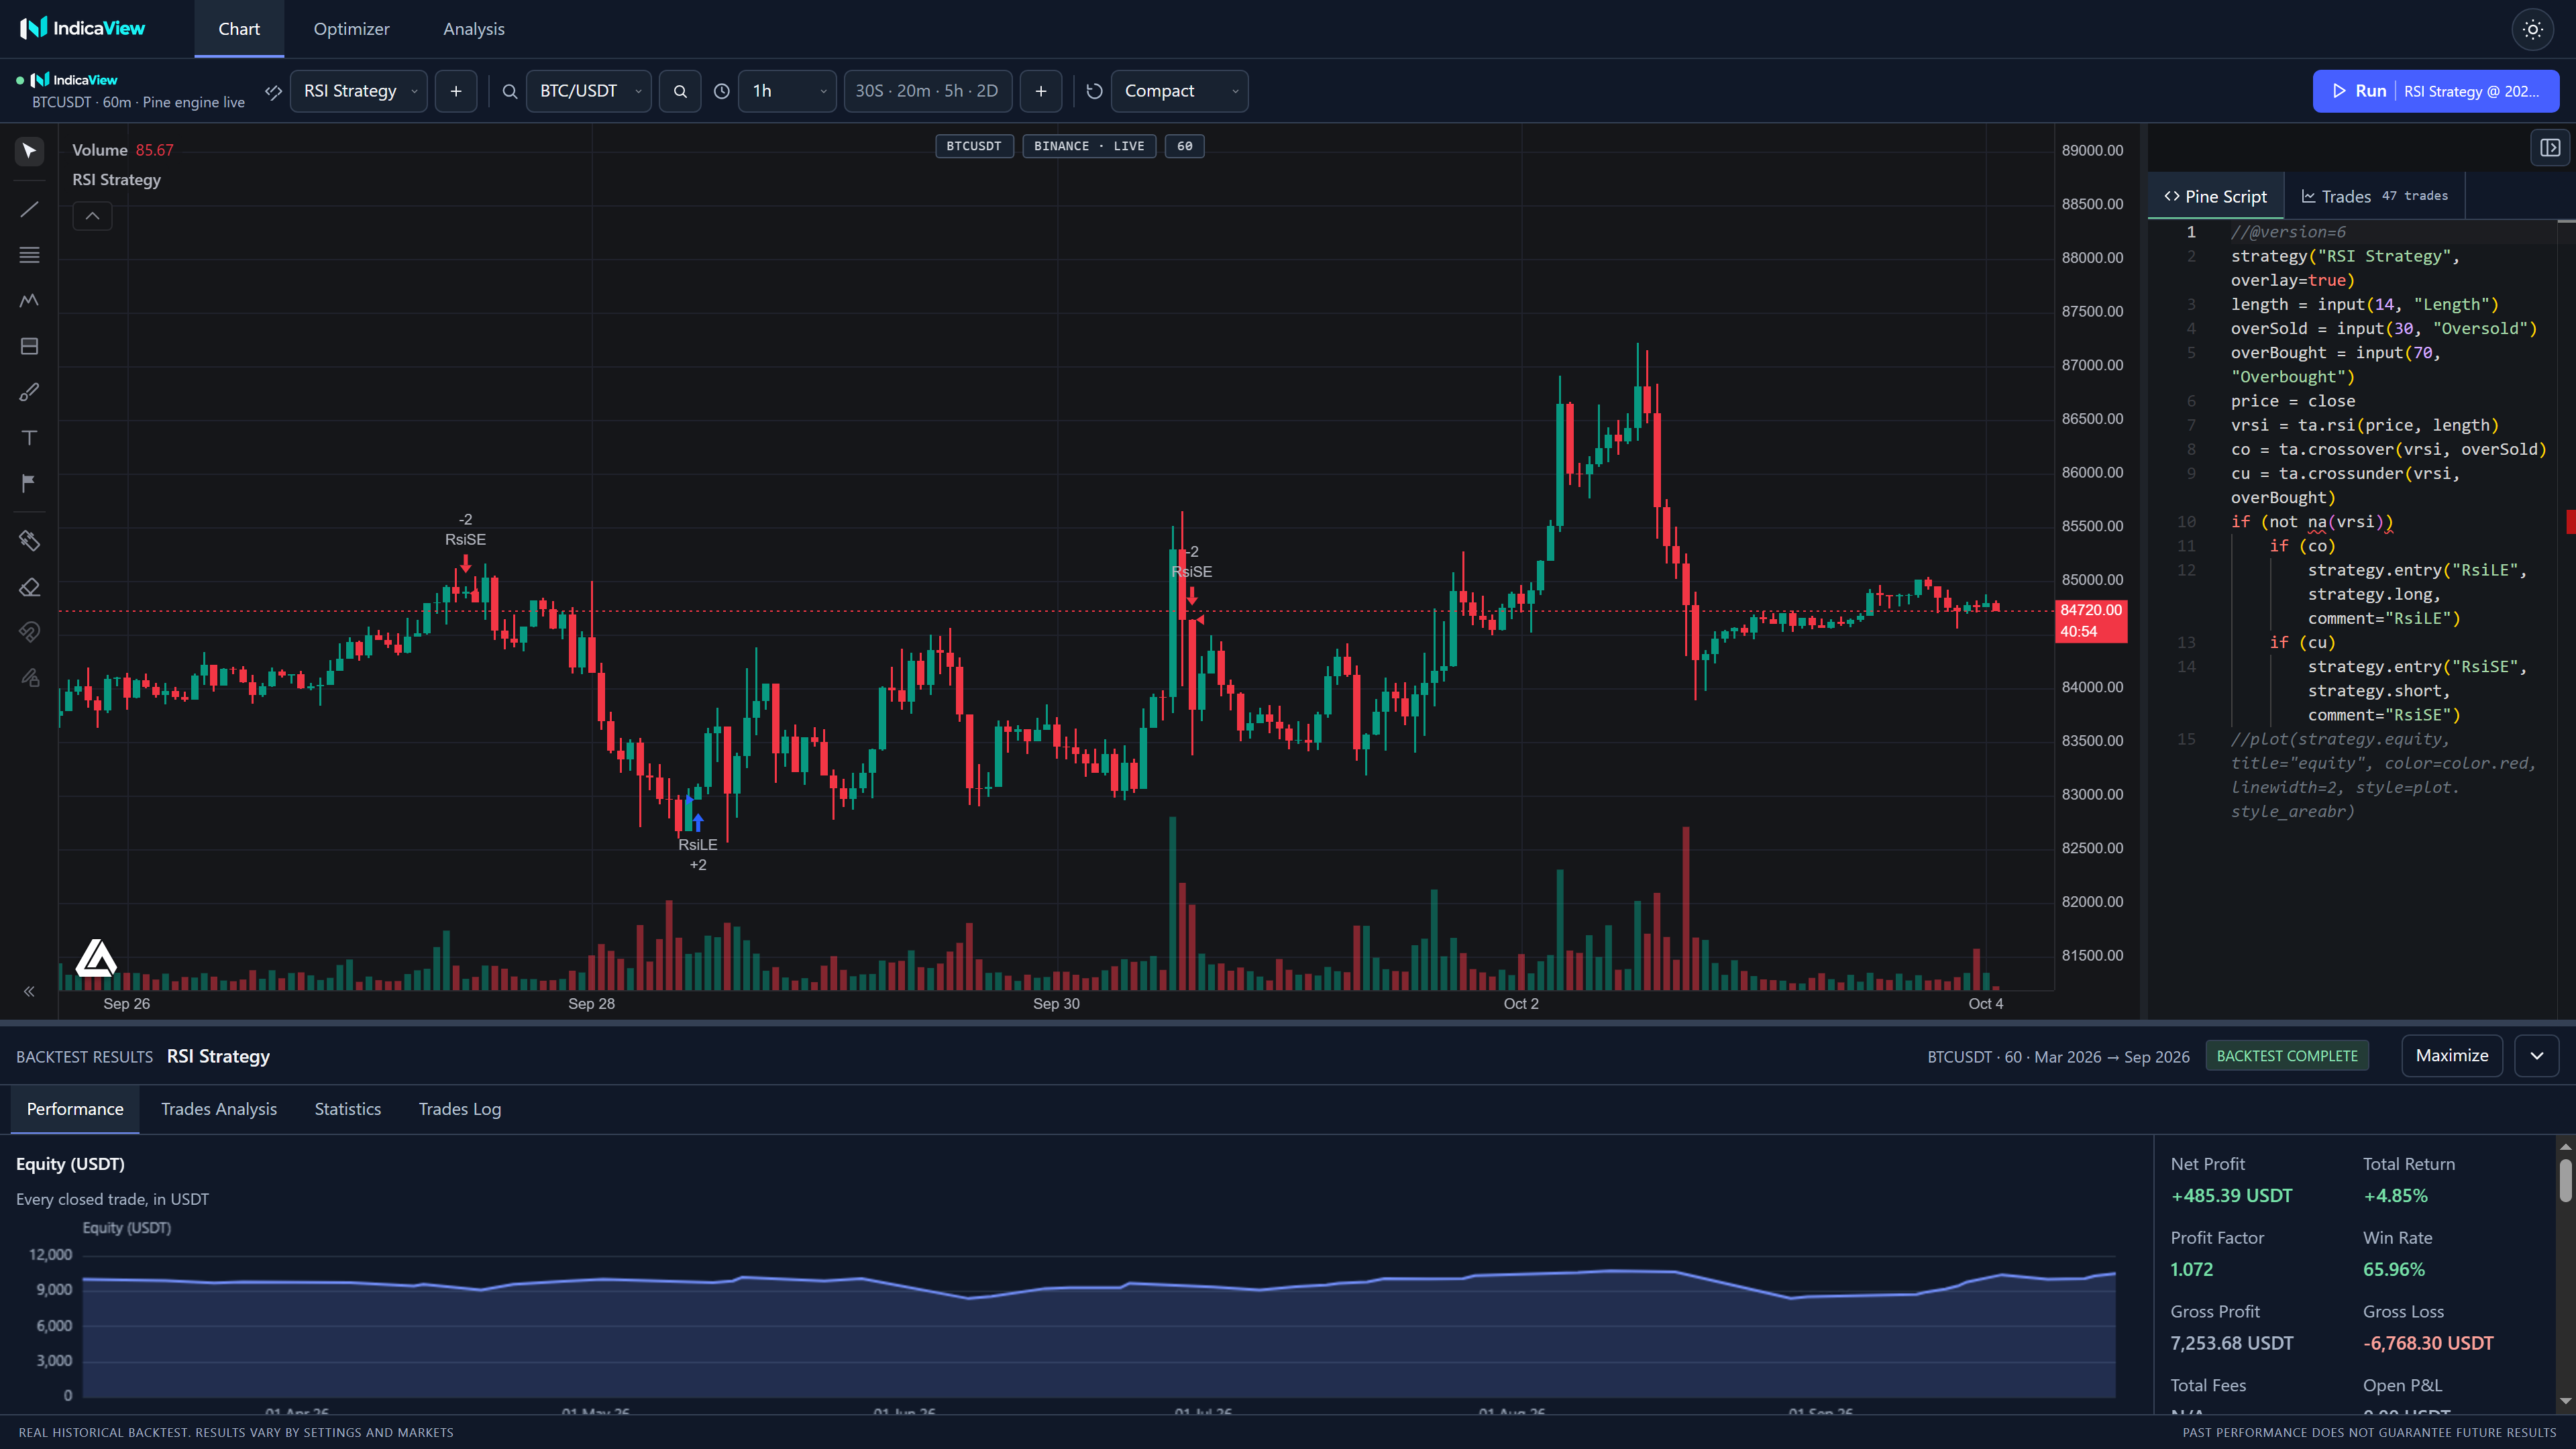
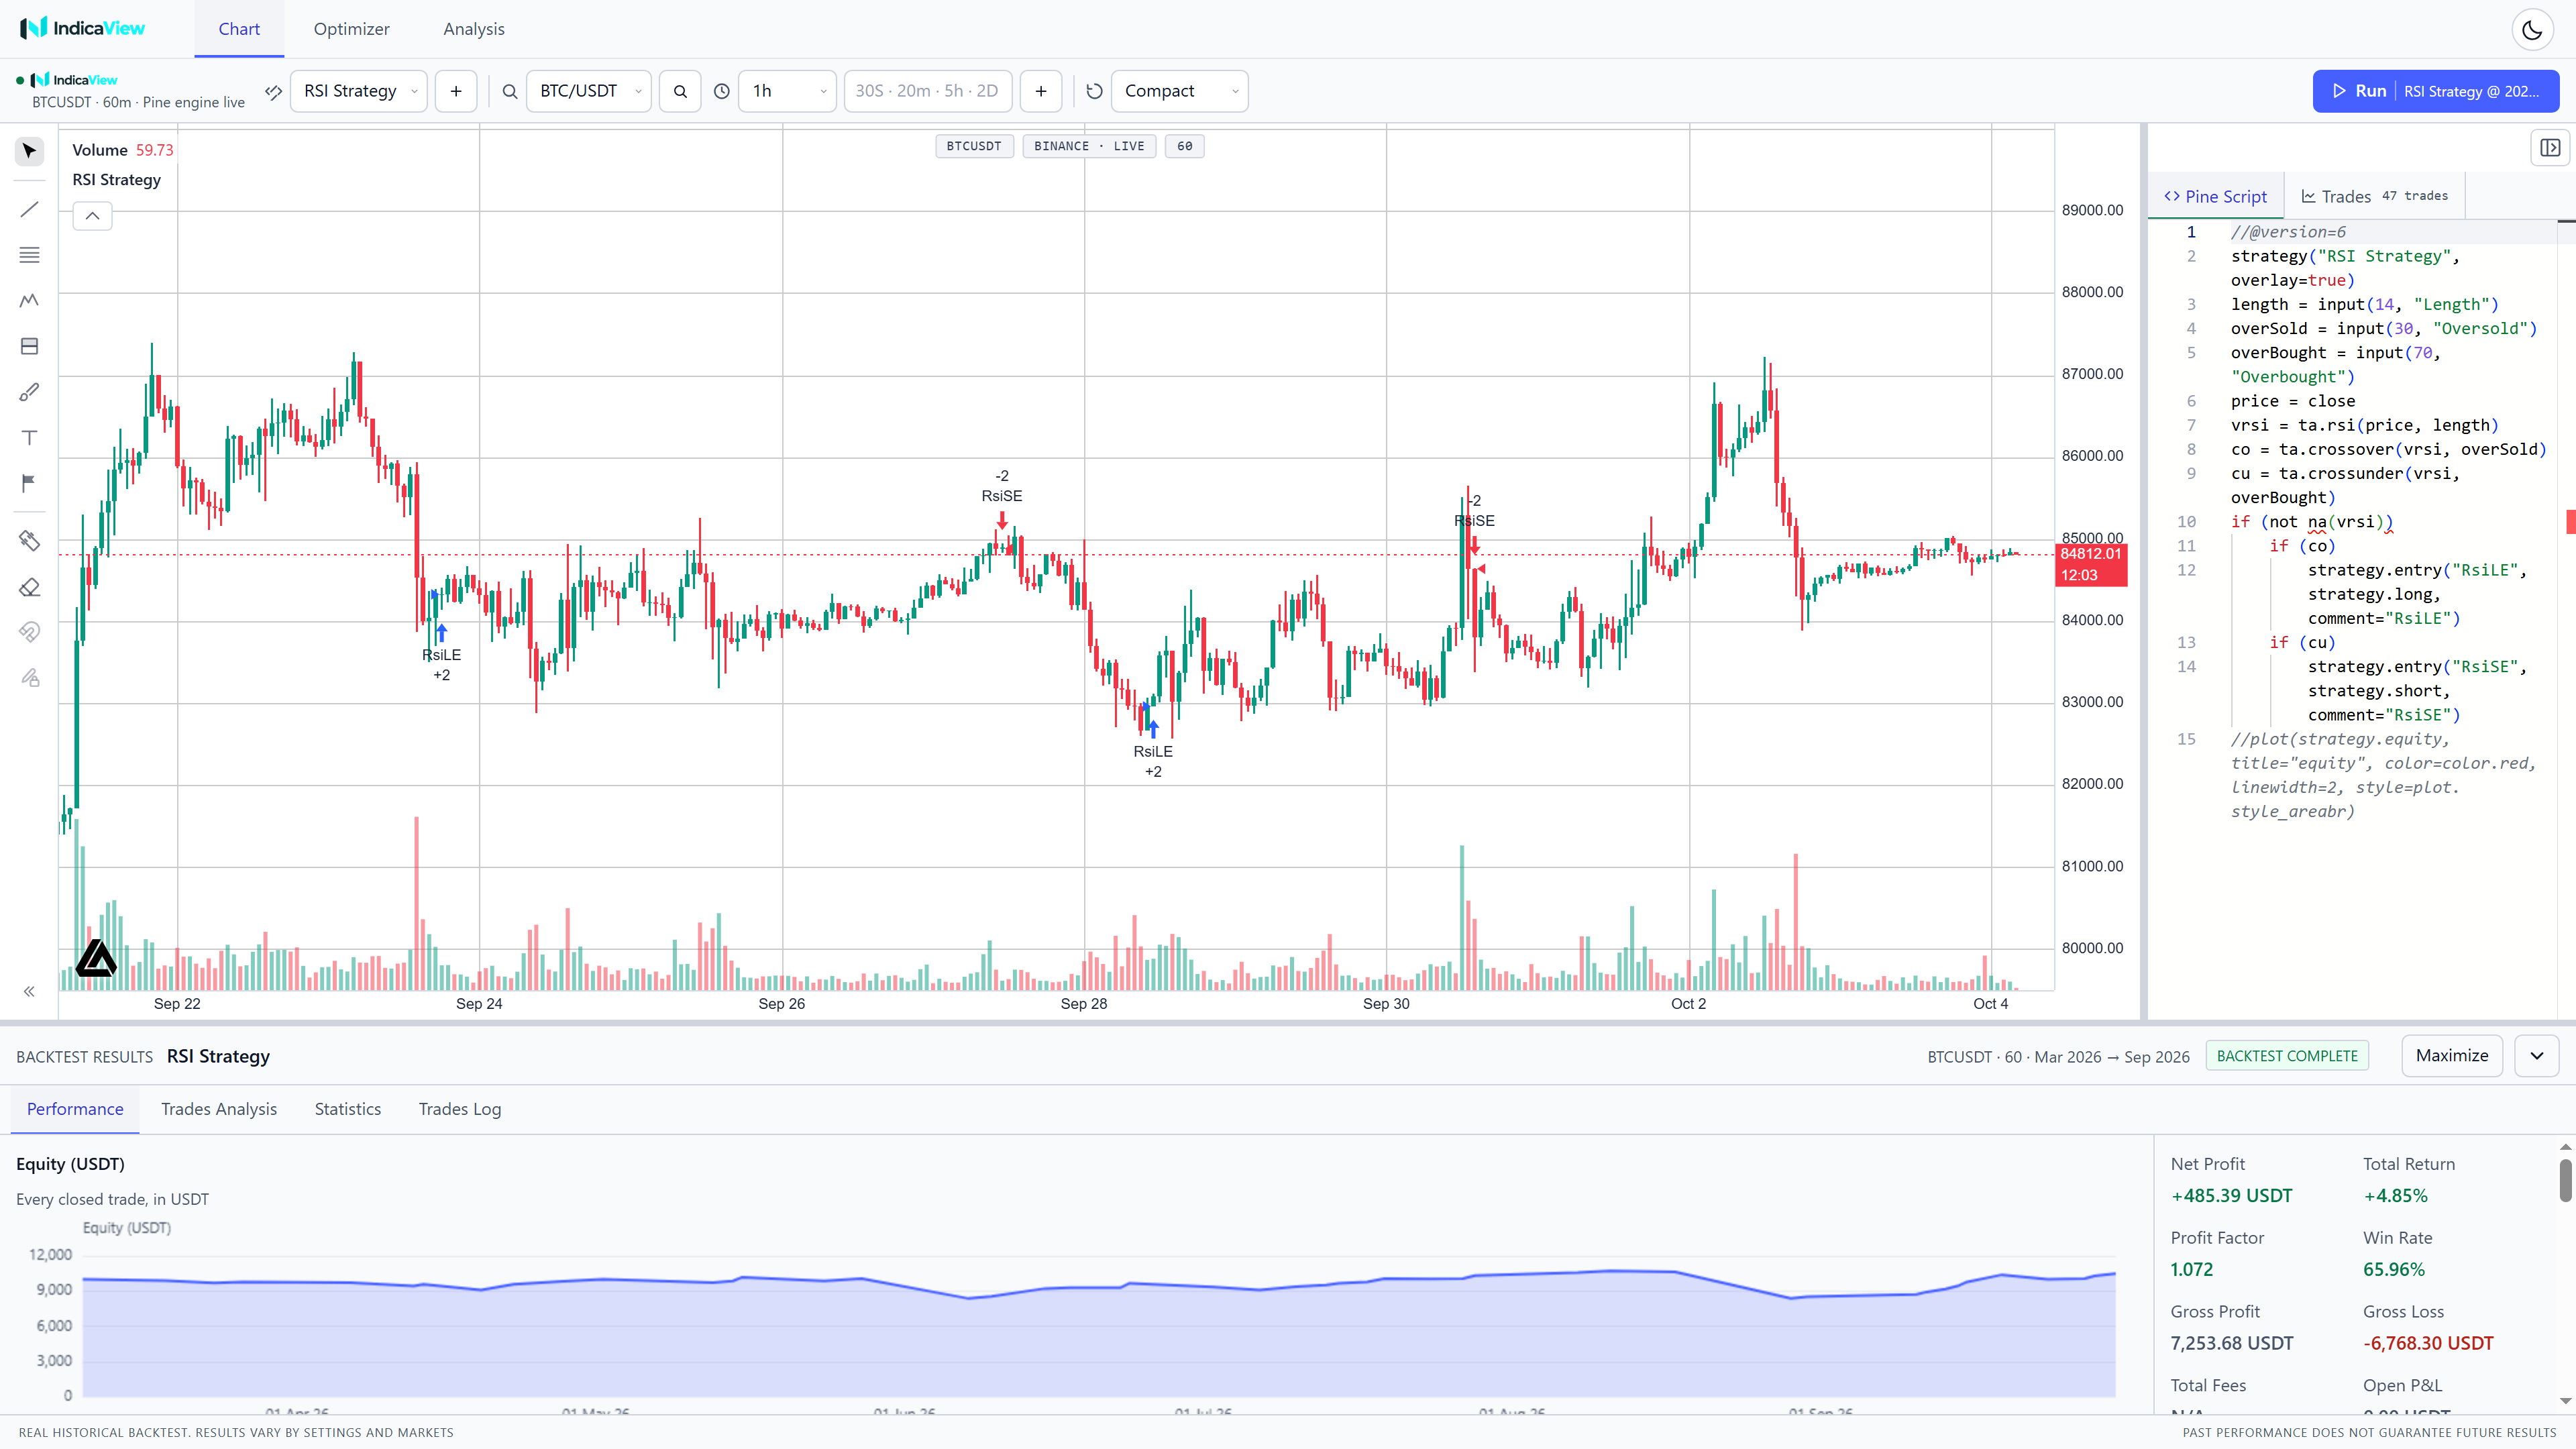
The chart is the strategy editor.
Candles stream from api.binance.com into a chart workspace.
Pick any pair, any timeframe from seconds to months, and set history depth
per timeframe — the chart keeps its own depth for each one, so switching
from 1m to 1D doesn't throw away what you'd already loaded.
Pine Script v6 is edited in the same pane, with your own theme. Every
input() you declare becomes an optimizer parameter
automatically — there is no config file and no translation layer between
the strategy and the search.
- 40+ metrics. Net profit, profit factor, Sharpe, Sortino, max drawdown and its duration, win and loss streaks, directional split, time in market, average win and loss duration.
- Honest labelling. The panel states when a figure excludes fees — because it does. Nothing is quietly netted.
- Scoped claims. Real P&L comes from
strategy()-mode scripts. Indicator-mode scripts draw markers, and their numbers are synthetic. The UI tells you which you have.
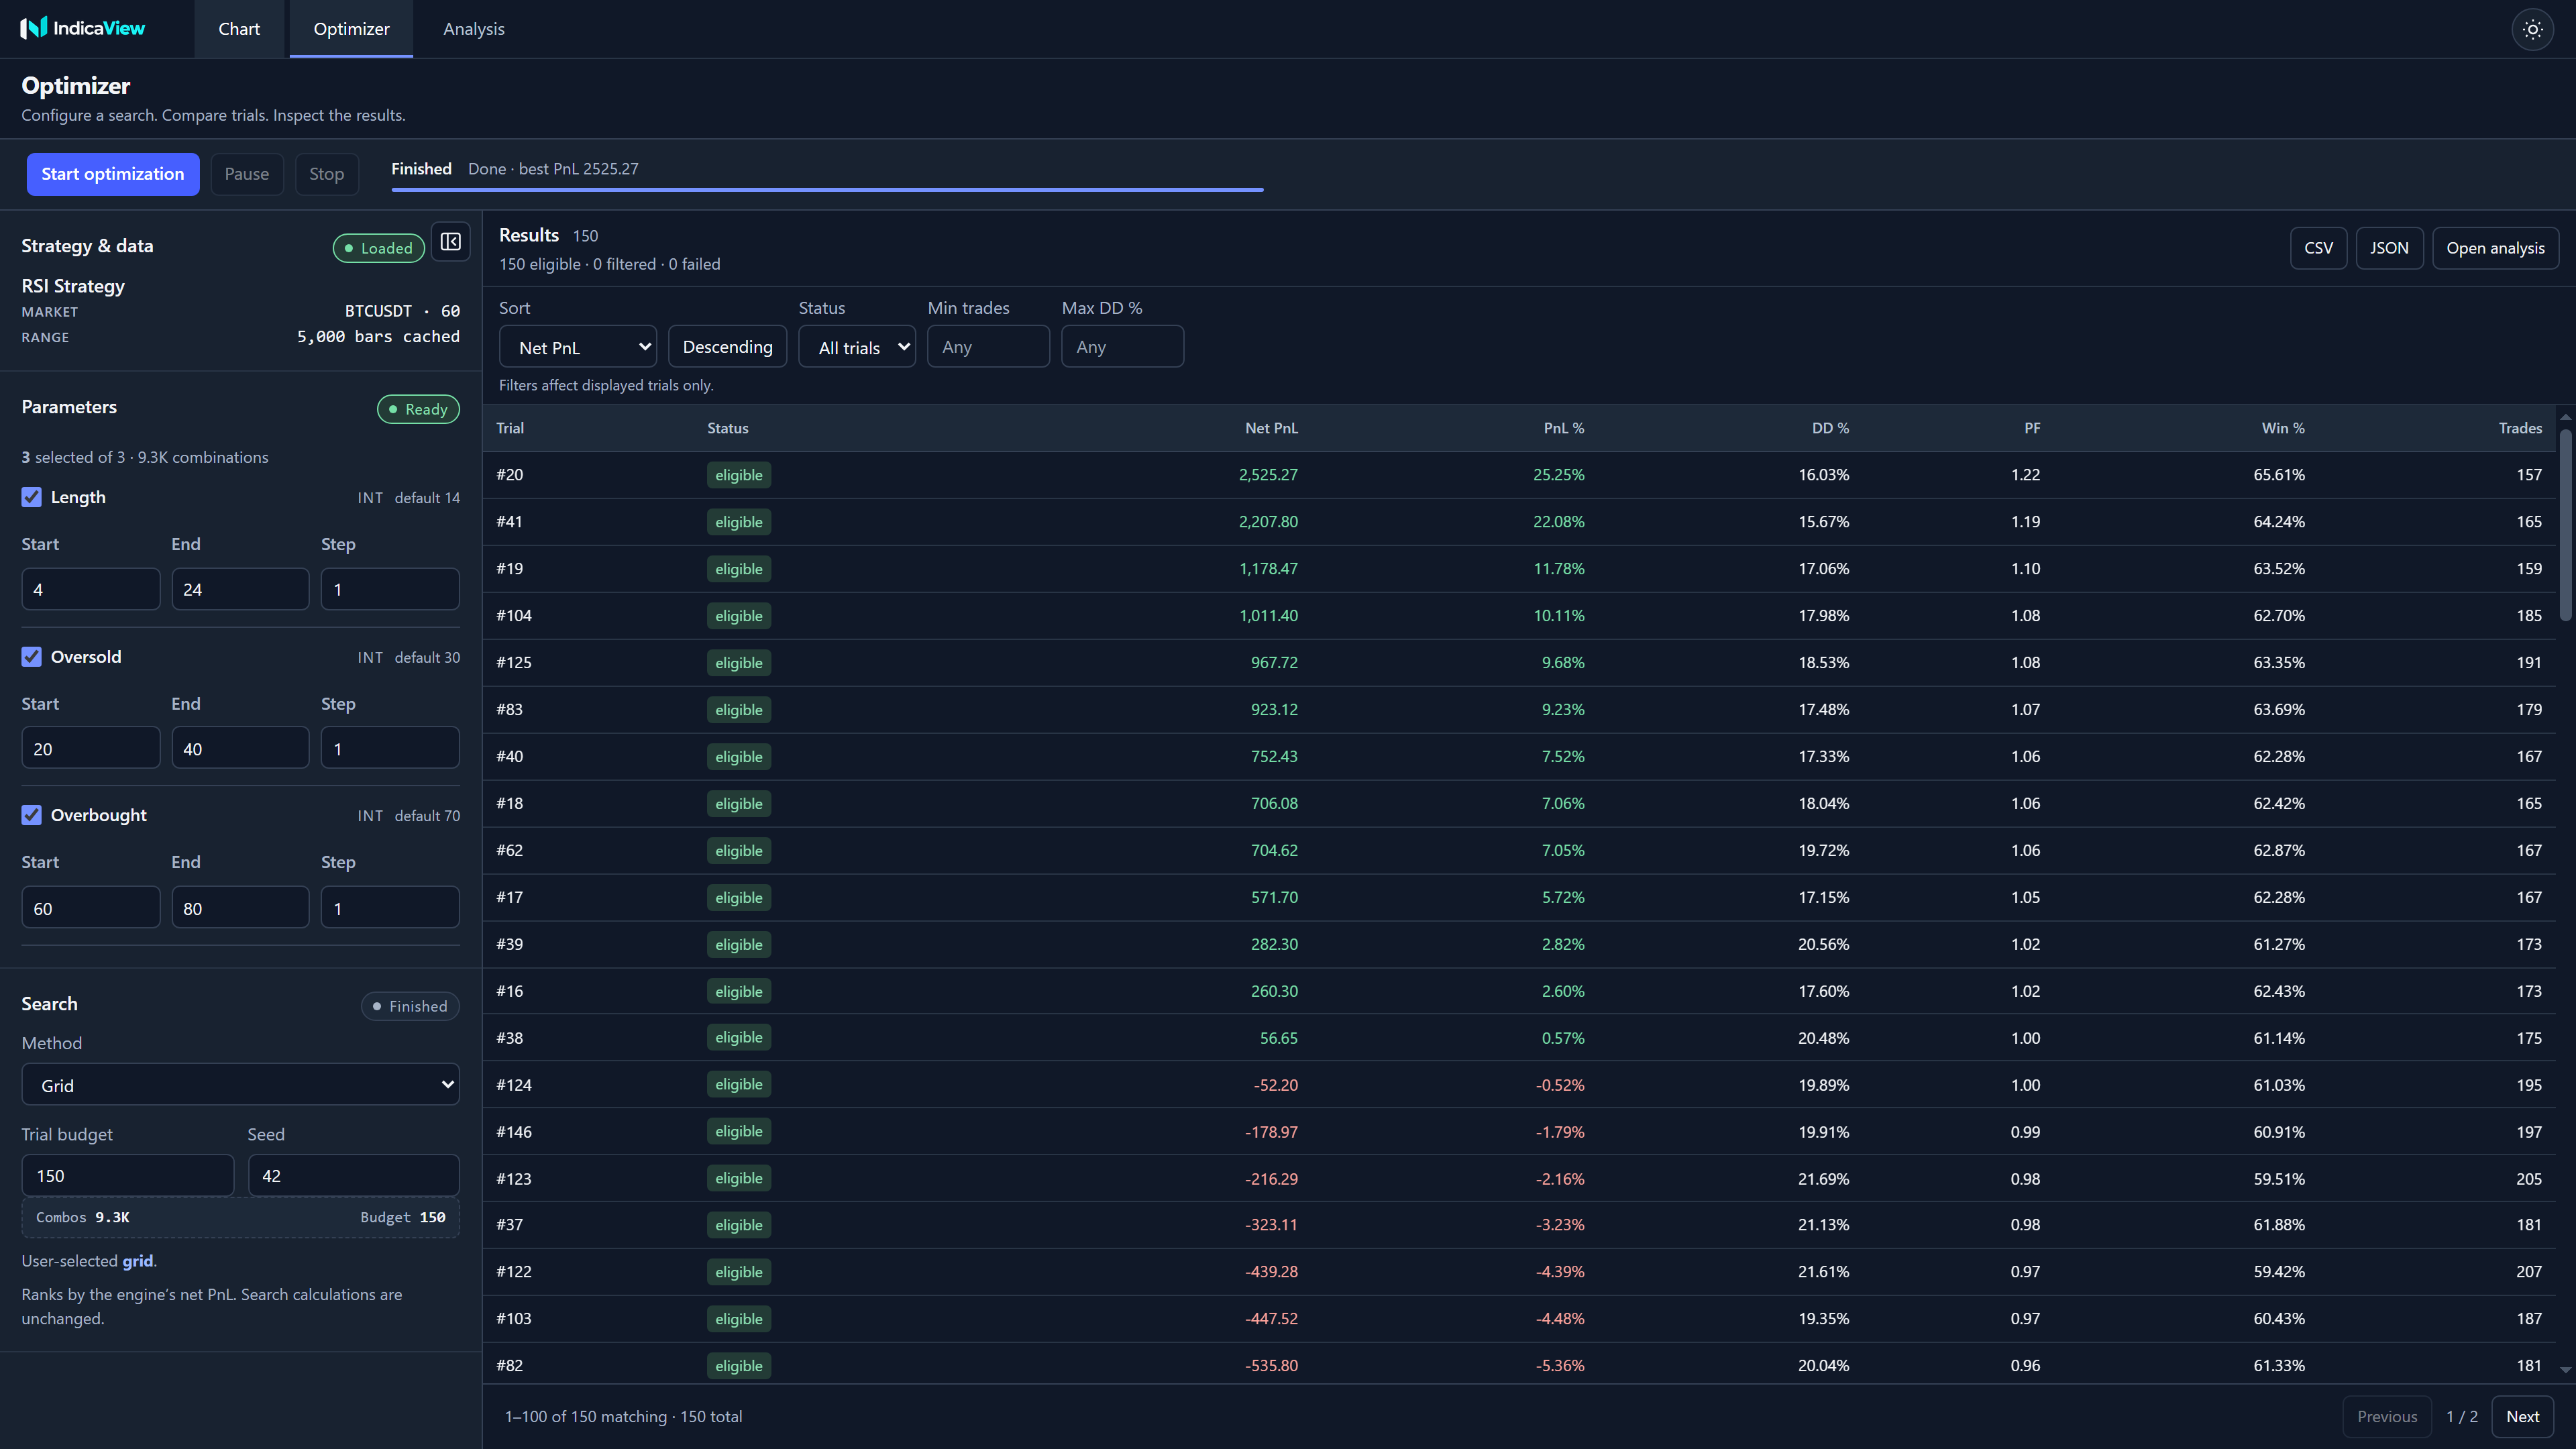
opt-mut4wjcn-3t78c4 · grid · seed 42 · 150 trials · best +2,525.2702 — Optimizer
Stop guessing the parameters.
A strategy is a function with knobs in it. The question is rarely does it work — it's which knobs are load-bearing and which are noise you fitted to one market.
Seven search algorithms ship, and Auto will pick one for you: Grid, Brute force, Random, Bayesian TPE, Simulated Annealing, a Genetic Algorithm, and NSGA-II for multi-objective work. Auto tells you which one it chose and why.
| Algorithm | How it searches | Good fit |
|---|---|---|
| Grid | Exhaustive sweep of every step in every range | Small spaces where nothing may be missed |
| Brute force | Every combination, unpruned | Verifying a space you can enumerate |
| Random | Uniform sampling of the space | A fast, unbiased first look |
| TPE | Bayesian, tree-structured Parzen estimators | Large spaces, few trials |
| Simulated annealing | Neighbouring moves with Metropolis acceptance | Continuous, smooth parameters |
| Genetic algorithm | Population, tournament selection, crossover, adaptive mutation | Mixed parameter types, long runs |
| NSGA-II | Non-dominated sorting, crowding distance, environmental selection | Multi-objective trade-offs, not one winner |
- Off the main thread. Trials run in a bounded worker pool sized to your device's logical CPUs and a measured memory model, so the tab stays responsive while a long run works.
- Reproducible. Every run records its algorithm, seed and job id. A result can be re-derived rather than believed.
- Yours to keep. Sort by any metric, filter by minimum trades or drawdown, export the whole run to CSV or JSON.
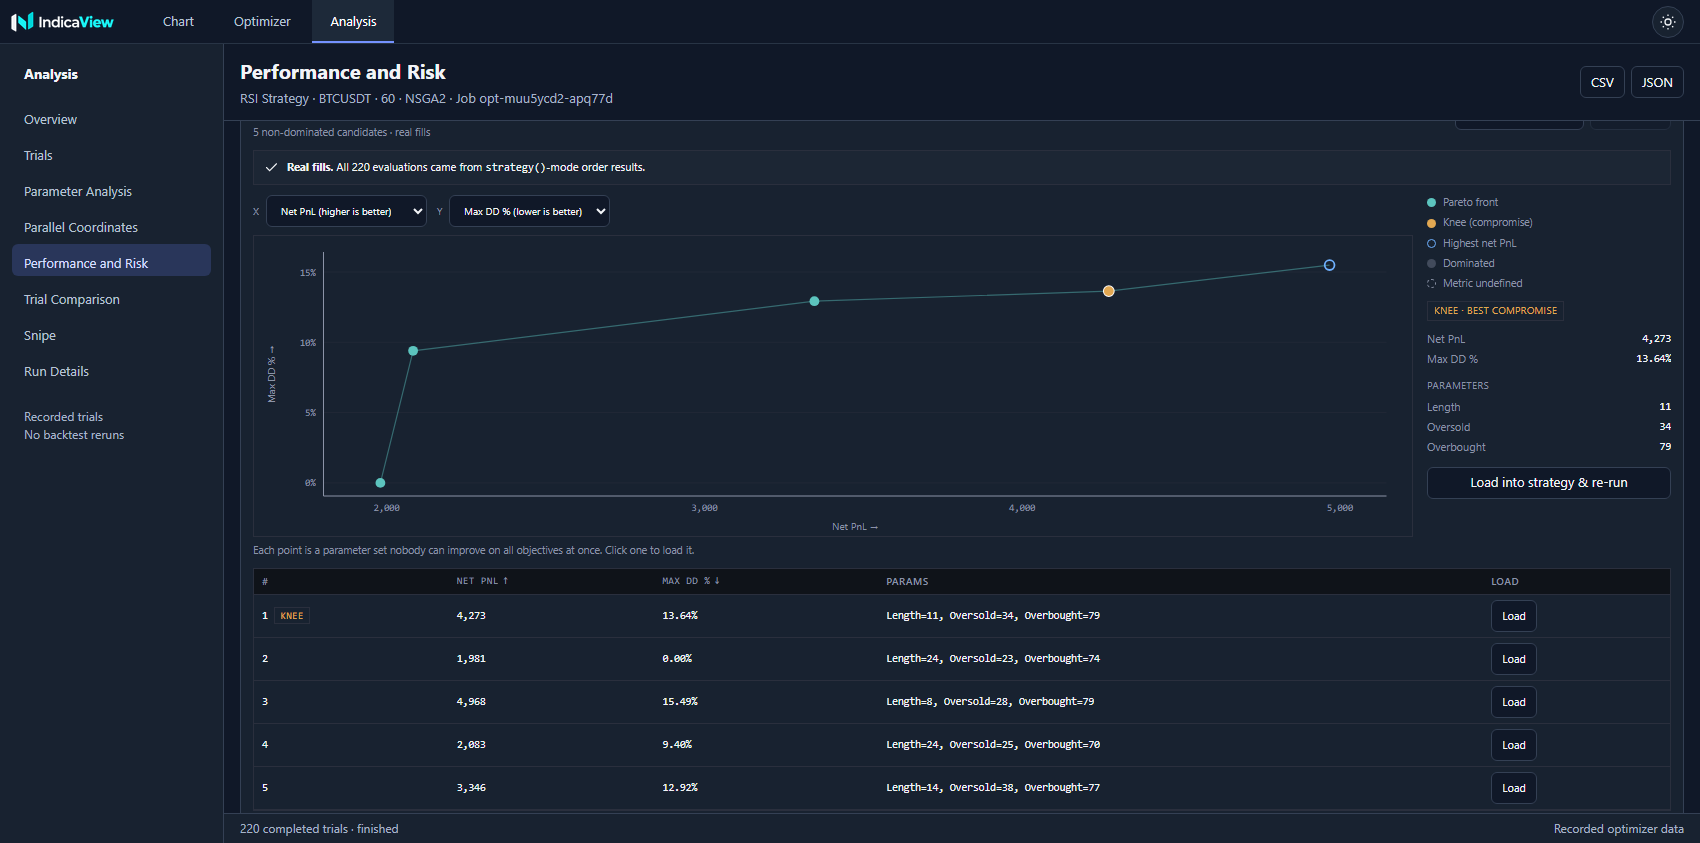
opt-muu5ycd2-apq77d · NSGA-II · BTCUSDT 60 · 220 trials · knee 4,273 PnL / 13.64% DD03 — Multi-objective
The answer is usually a trade-off, not a winner.
Ask an optimizer for "the best" and it will hand you one parameter set, having quietly decided that one number mattered most. That is a choice you made by accident. NSGA-II makes it explicit: pick 2 to 3 objectives and it returns the Pareto front — every parameter set nobody can improve on all of them at once.
| Objective | Sense |
|---|---|
| Net PnL | maximize |
| PnL % | maximize |
| Max DD % | minimize |
| Max DD | minimize |
| Profit Factor | maximize |
| Sharpe | maximize |
| Win Rate | maximize |
| Trade Count | minimize |
- Read the shape. Plot any two objectives, see the non-dominated front against the dominated cloud, and let the workspace mark the knee — the point where the curve bends, offered as the best compromise rather than a verdict.
- Send it back. Any point on the front loads straight into the strategy and re-runs, so a trade-off becomes something you can verify rather than argue about.
- Constrain what you must. Optional limits on max drawdown, minimum trades and minimum profit factor are off by default; switch one on and violators are marked infeasible.
Stated plainly: a front is a map of trade-offs, not a profitability claim. A stock run usually exhausts its trial budget before the population converges, so what you see is a snapshot of what was evaluated — the interface says so too. And Trade Count is a cost: minimising it admits the do-nothing strategy to the front, which the app flags.
04 — Analysis
Find out which knob mattered.
A best-P&L number on its own is a starting point, not an answer. The analysis workspace exists to make the answer argue back: which inputs actually moved variance, where the trials cluster, and whether the top result got there by luck.
Eight views ship over the recorded trials:
- Overview — run provenance, counts, best result, objective over time
- Trials — every run, sortable and filterable
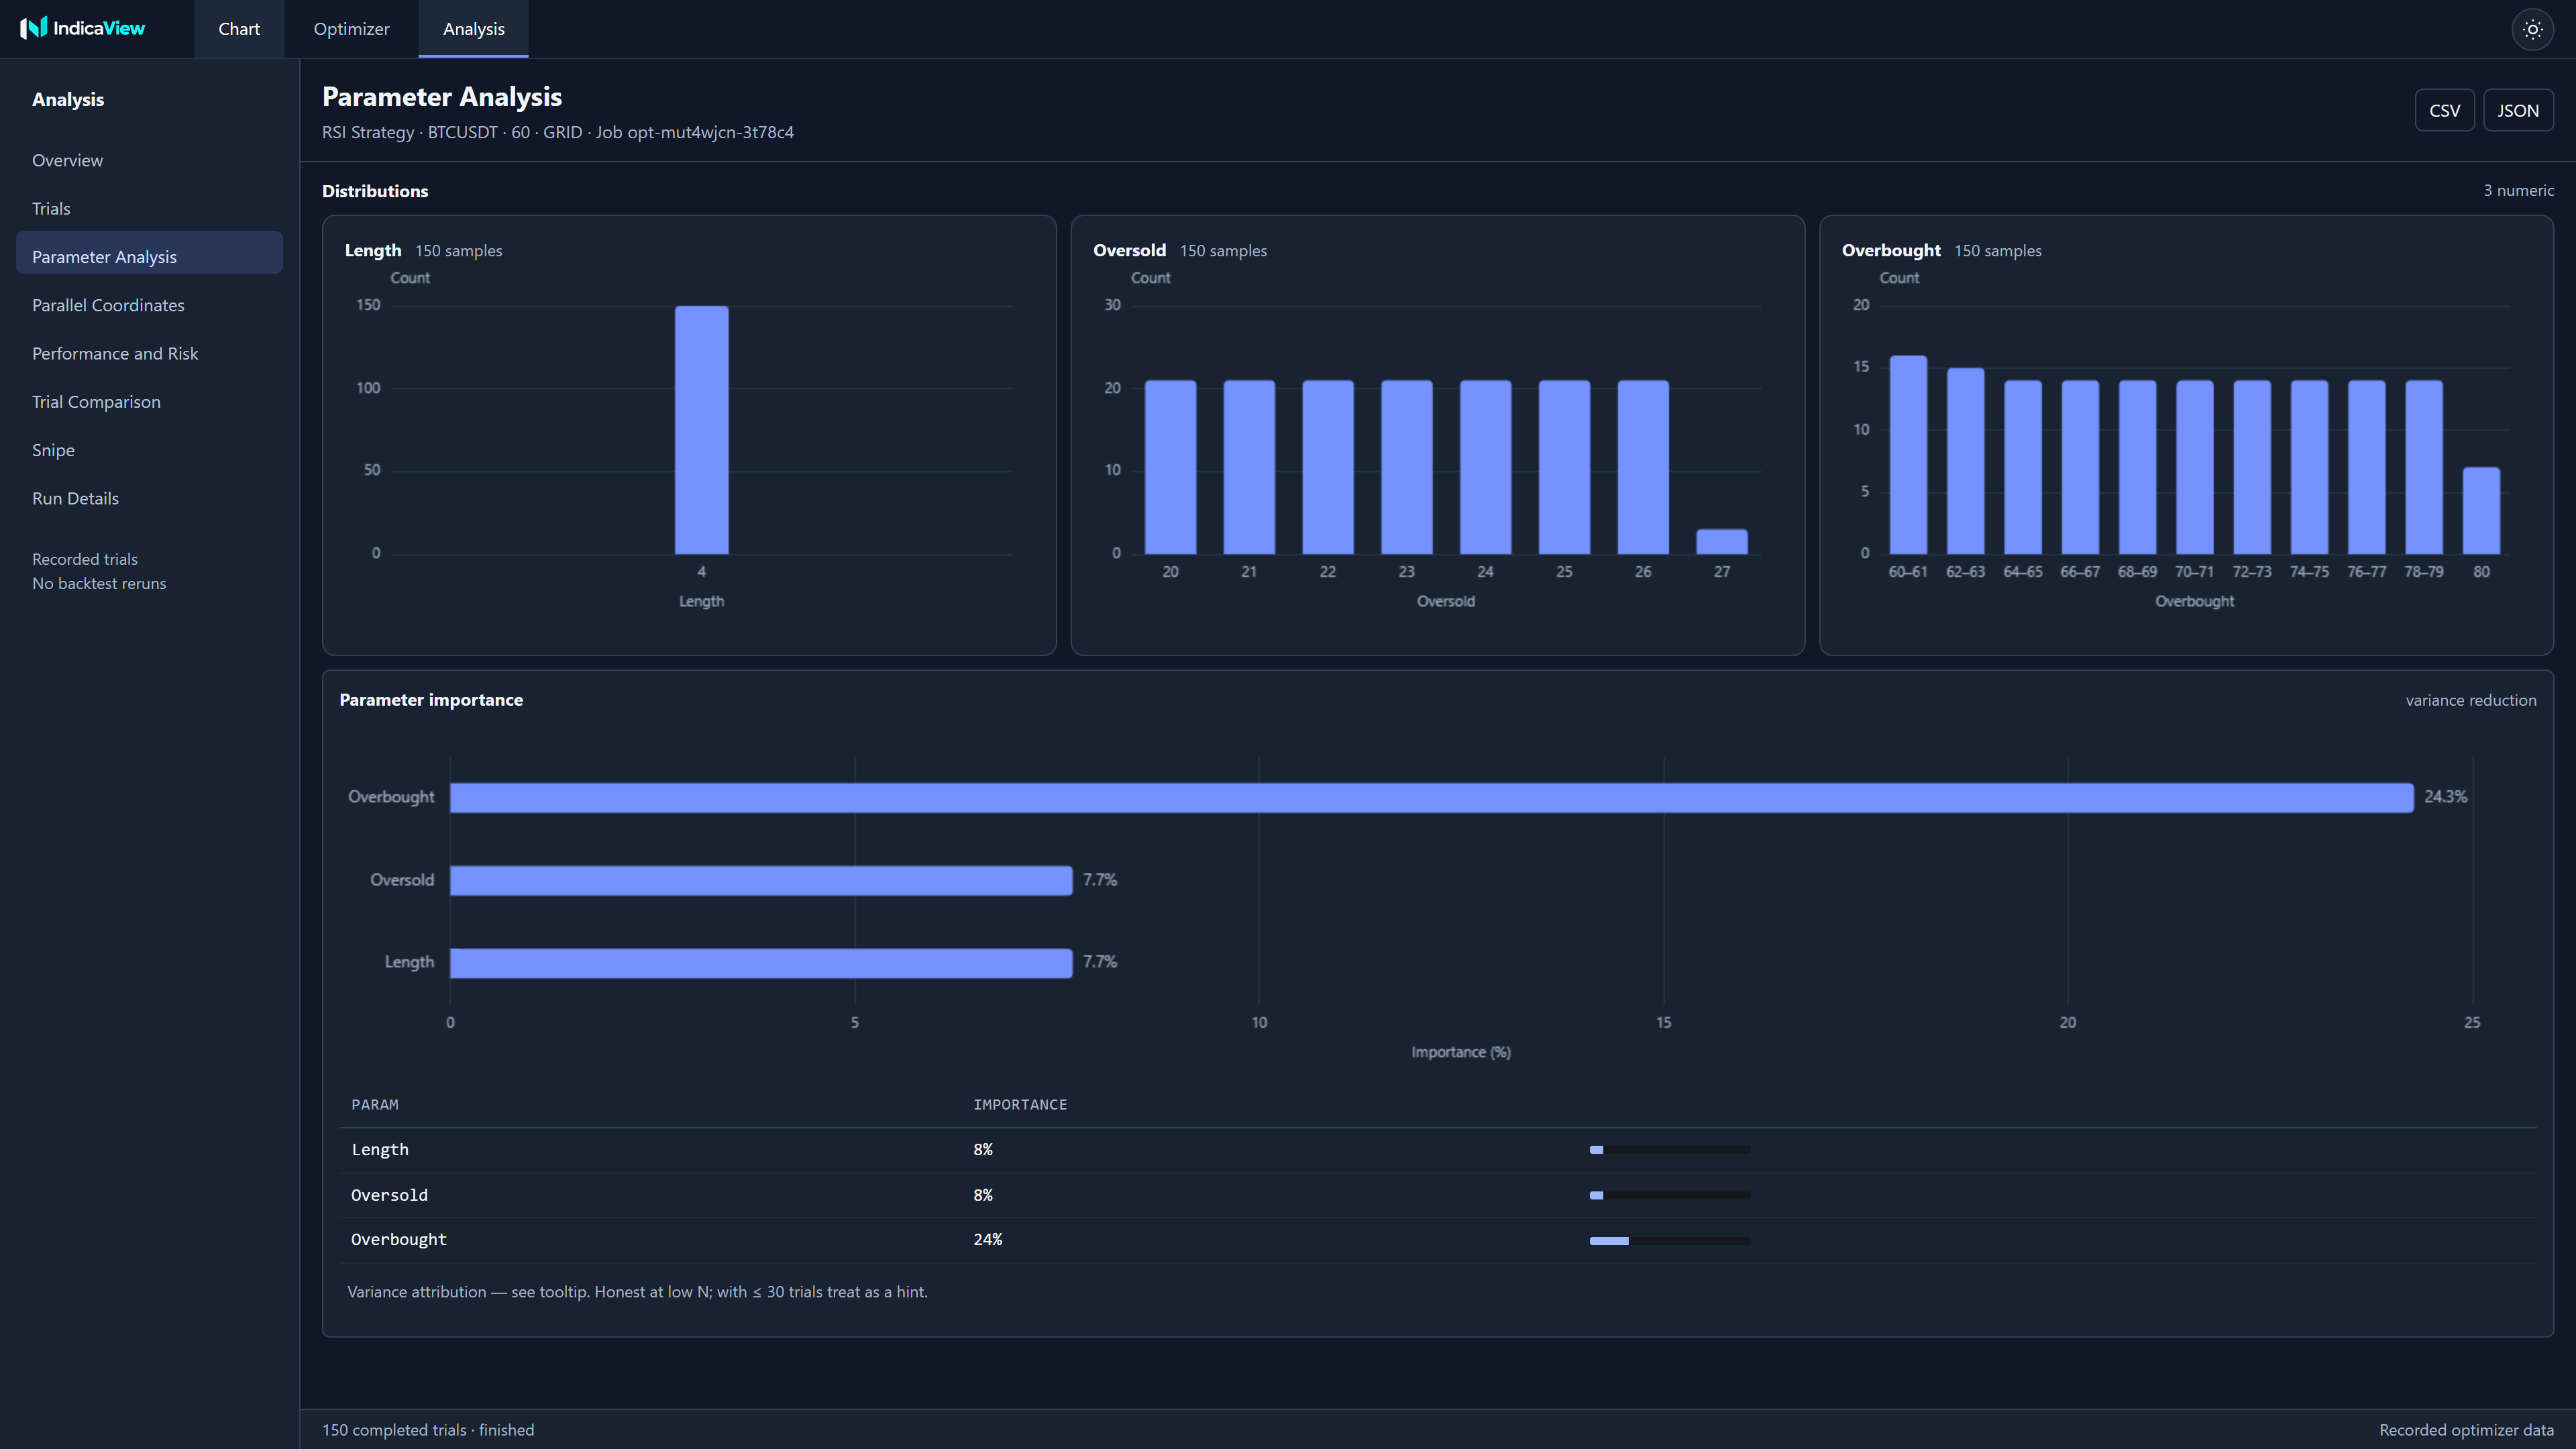
- Parameter Analysis — distributions and variance-reduced importance
- Parallel Coordinates — the whole trial set on one plot
- Performance and Risk — return against drawdown, per trial, with the Pareto front
- Trial Comparison — any two runs, side by side
- Snipe — a single point, opened up
- Run Details — algorithm, seed, budget and provenance for the run
The tool grades its own confidence. When the sample is thin, the parameter importance view says so in the caption rather than presenting a ranking as fact — because an importance score computed from thirty trials is a hint, not a measurement.
Auto picks one of the six single-objective methods for you. It never selects Simulated Annealing, the Genetic Algorithm or NSGA-II — the last because the Auto picker has no notion of an objective vector, so multi-objective runs are manual-select on purpose.
05 — Craft
Built like an instrument, not a landing page.
One toggle in the header repaints the whole workspace — chart, Pine editor, results panel, and all three workspaces follow it. It is a real second theme rather than an inverted filter: light mode brings its own borders, selected-row tints, and status colours, and the choice persists across reloads.
06 — FAQ
Questions worth answering plainly.
These are the questions that decide whether a backtester is worth trusting, answered without hedging.
What is IndicaView?
A hosted Pine Script v6 backtester and strategy research
workspace for crypto. It fetches Binance klines directly, executes your
strategy against them, reports equity, drawdown, Sharpe, Sortino and 40
other metrics, then searches the strategy's own input()
parameters with seven algorithms and analyses the recorded trials. The part
most backtesters skip is that it can optimise two or three metrics at once
and hand back a Pareto front instead of a single winner, and it ranks which
parameters actually moved the result.
Which parameter optimization algorithms does it support?
Seven: grid, brute force, random search, Bayesian TPE, simulated annealing, a genetic algorithm, and multi-objective NSGA-II. An Auto mode picks one of the six single-objective methods for you from the shape of the search space and your budget, and explains its choice. Auto never selects simulated annealing, the genetic algorithm or NSGA-II; NSGA-II is manual-select because the Auto picker has no notion of an objective vector.
What is a Pareto front and why does it matter here?
Most optimizers collapse every trial into one score and return the winner, which quietly assumes one metric decides. NSGA-II optimises two or three metrics at once and returns the set of parameter sets where you cannot improve one objective without giving up another. You choose two or three objectives from Net PnL, PnL %, Max DD %, Max DD, Profit Factor, Sharpe, Win Rate and Trade Count, and the workspace plots the front, marks the knee point as the best compromise, and lets you load any point back into the strategy. It is a map of trade-offs, not a profitability claim, and it is a snapshot of what was evaluated rather than a converged front.
Do I need an account to use it?
Not to compute. The chart, optimizer and analysis workspaces are fully available to a guest with no session at all, including complete optimizer runs. An account adds sign-in, a profile and a security tab, and it is where your credit balance and billing details will live once usage metering is switched on. It does not unlock the optimizer, and it does not sync your saved runs, bar cache or optimizer results between machines, because those stay in your browser.
What does IndicaView cost?
Nothing is priced yet, and this page will say so until it is. IndicaView is a hosted service whose usage will be metered in credits, but the credit plan, its price and how a balance is topped up have not been announced. You can use the workspace today without a paid plan; when credit-based billing goes live it will be described here and in your account, and the metering will be visible before it affects a run.
Where does my data go?
Candles are fetched by your browser from the public Binance REST API
at api.binance.com. Cached bars, backtest runs and optimization
results stay in browser storage. Signed-in accounts use Supabase for
authentication and store a profile, saved scripts, custom symbols and
timeframes, preferences and in-app notifications. Those records are
scoped to their owner. There is no telemetry or analytics, and only the
publishable key reaches the browser.
Can it place real trades?
No. IndicaView is a research simulator. It never connects to a broker and never places an order. It helps you test a strategy, compare parameter sets and understand which parameters carry the result. It makes no promise of profit.
Do the reported profits include trading fees?
Not currently, and the interface says so. The results panel carries an
explicit "Includes fees? No" disclosure rather than quietly
presenting gross figures as net. Separately, indicator-mode Pine scripts
draw markers without fills, so only strategy() mode produces
real profit and loss numbers, and the interface tells you which mode your
script is in.
Can it evaluate prop-firm challenges?
There is a separate Python command-line tool that runs a trade log through a Monte Carlo simulation to estimate challenge pass probability, expected value and stagnation. It is not part of the browser workspace and does not read your optimization runs directly. It works from a trade log you export, and it resolves its firm directory at runtime rather than hardcoding any particular firm.
Can I reproduce a result?
Every run records the algorithm, the seed and a job id, and every trial is retained and exportable as CSV or JSON. A reported number is something you can re-derive and inspect rather than something you have to believe. The parameter importance view also grades its own confidence and labels a thin sample as a hint rather than a fact.
Is it based on Pine Script and TradingView?
It runs Pine Script v6 syntax, but it is not affiliated with, or
dependent on, TradingView. The charting and execution layers are Vela and
PineTS from LuxAlgo's open-source stack, and strategies are ordinary
.pine text files you own and can read in any editor.
No Pine script ships without a verified run. Every strategy bundled with
IndicaView passed a clean pinets-cli execution against a known
dataset before it was allowed near the optimizer — and the charting,
engine and simulation layers are LuxAlgo's open-source stack
(Vela, PineTS, prop-firm-sim), not something rebuilt from scratch.
Open it and run something.
IndicaView is hosted: there is nothing to install and nothing to run yourself. Create an account to keep a profile and a security tab, or start as a guest — the chart, the optimizer and the analysis workspace are all reachable with no session at all. The account is also where your credit balance and billing details will live once usage metering is switched on.
What it doesn't do
- No live order execution. Nothing touches a broker.
- No promise of profit. It is a research tool, not a signal service.
- An account does not unlock the optimizer, and does not sync your runs between machines.
- Prop-firm Monte Carlo evaluation is a separate command-line tool, not a workspace feature.
Want the mechanics first? The documentation covers the engine, the search space, the algorithms and the endpoints.
# IndicaView runs as a hosted service
# nothing to install, nothing to self-host

workspace   https://app.indicaview.com/index.html
docs        https://indicaview.com/docs/

# usage will be metered in credits
# no plan is priced yet
Hosted · browser-based · no order execution